
Core Mental Models
- Google Sheets is More Than just a spreadsheet (it’s an intelligent data analytics software
- Works great with structured data
- Function is the heart of GG Sheets
Quick Start with sheets.new
พิมพ์ sheets.new ไปที่ address bar ของ Chromium Browser แล้ว Browser จะสร้าง Google Sheets ใหม่ให้โดยอัตโนมัติ
Data Types
- Numeric: 1, 100.5
- String: “Hello”, “World”
- Boolean: TRUE, FALSE
- Date: “2026-09-19
Function
Function ใน Google Sheets คือการเปลี่ยน Input เป็น Output ถ้าเปรียบเทียบกับการทำอาหาร:
- วัตถุดิบคือ Input (บางอย่างเป็น optional ได้)
- อาหารคือ Output
ตัวอย่างเช่น หากเราต้องการทำซุป
- Input (Required): น้ำ, หัวหอม, เนื้อ, ซอส
- Input (Optional): พริก
- Output: ซุป
วิธีการใช้ Function สามารถทำได้ด้วยการพิมพ์ = แล้ว Google Sheets จะมีคำแนะนำขึ้นมา
Basic Functions
COUNT= นับ cell ที่เป็นตัวเลขCOUNTA= นับ cell ที่มีข้อมูล ไม่ต้องเป็นตัวเลขก็ได้MIN= หาค่าต่ำสุดMAX= หาค่าสูงสุดAVERAGE= หาค่าเฉลี่ยSUM= หาผลรวม
Custom Functions
ไปที่ Data → Named functions แล้วสร้าง function ของเราเองขึ้นมา
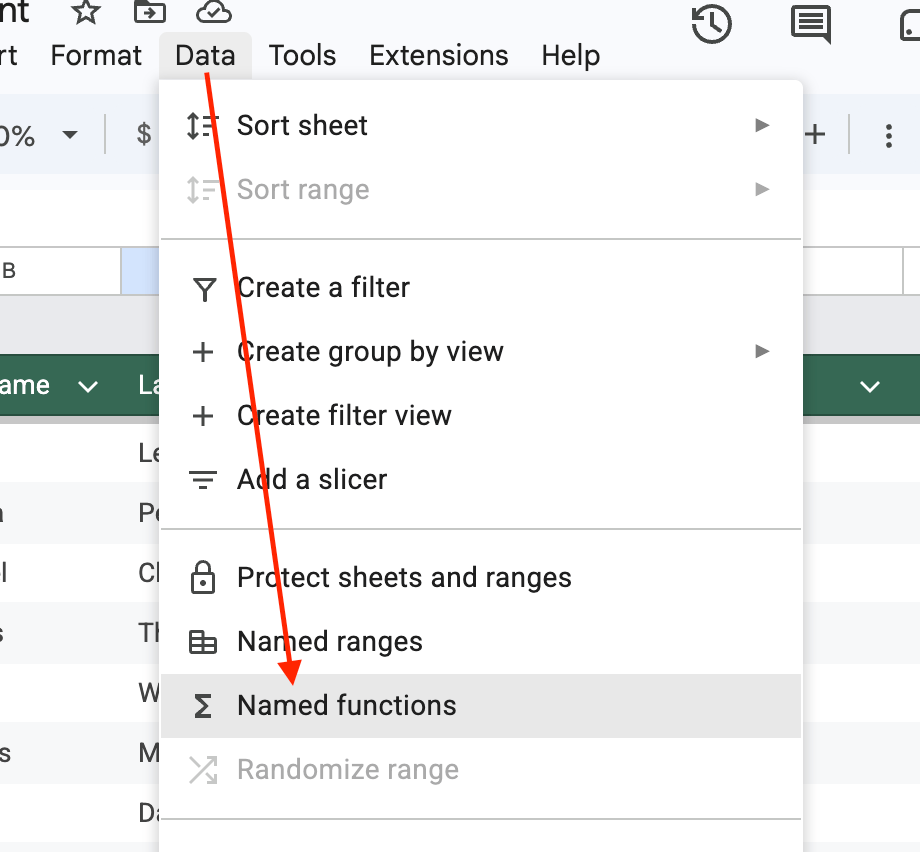
เช่น function สำหรับสร้าง email =CREATE_EMAIL(CRM_DATA[First_Name], CRM_DATA[Last_Name])
Convert to Table
หลังจากที่เราทำการ Import ข้อมูลเข้าไปที่ Google Sheets แล้ว เราสามารถไปที่ Format → Convert to table เพื่อให้ Google Sheets จัดข้อมูลของเราให้เป็น Format ได้โดยอัตโนมัติ
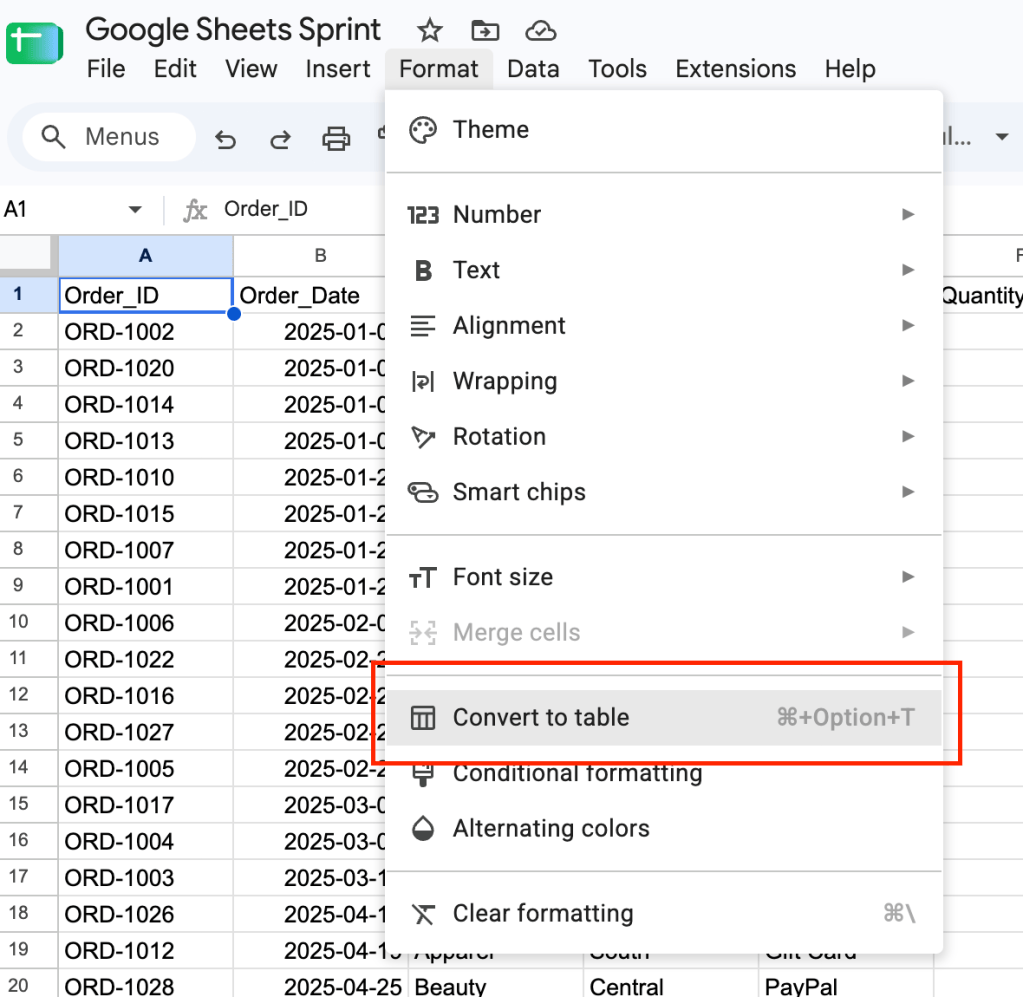
Before
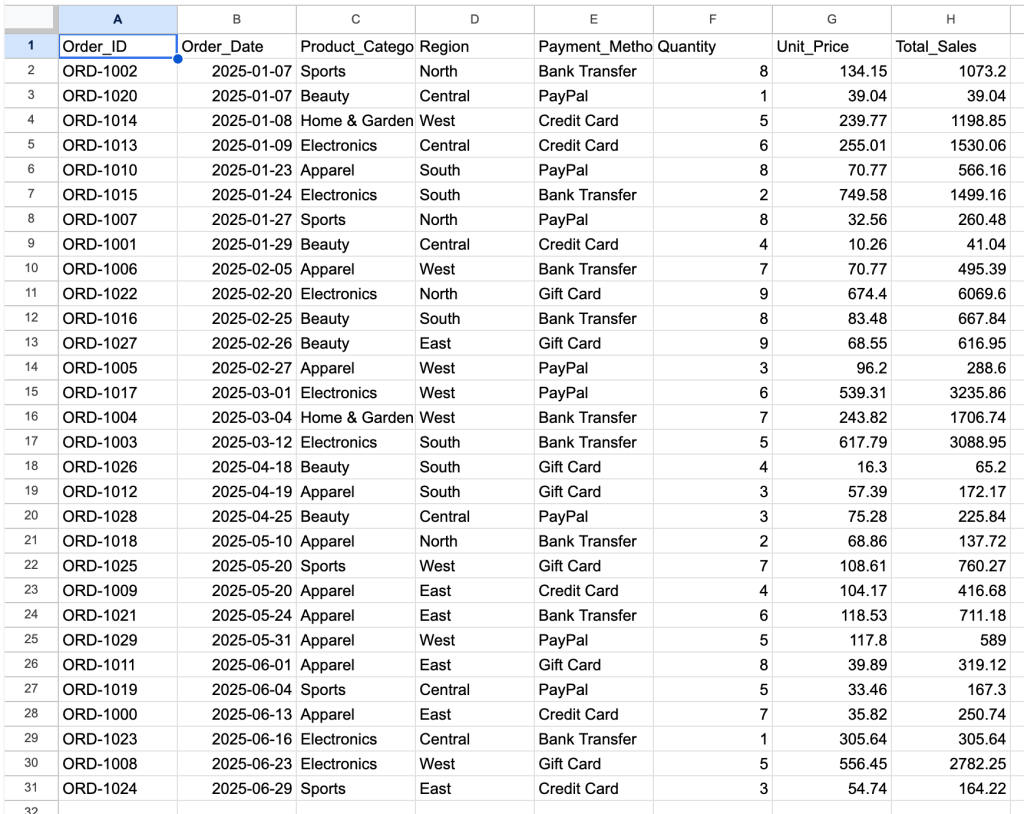
After
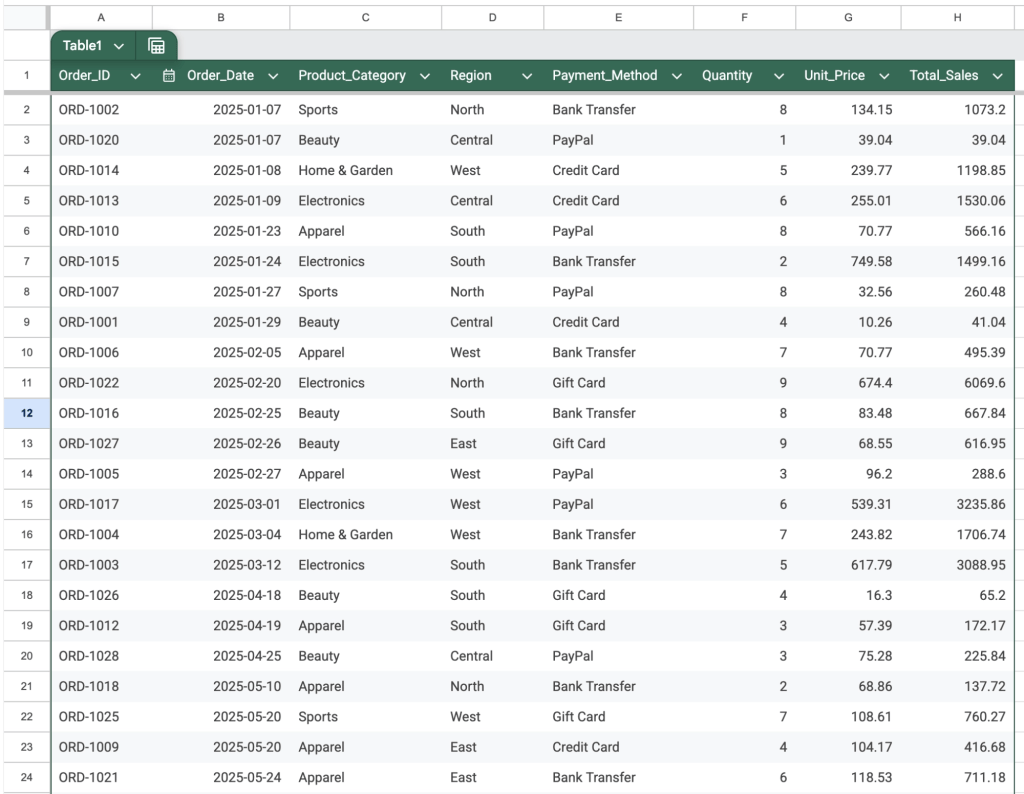
เราสามารถกำหนดประเภทของข้อมูลแต่ละ Column ได้โดยไปที่หัว Column แล้วเลือก Edit column type
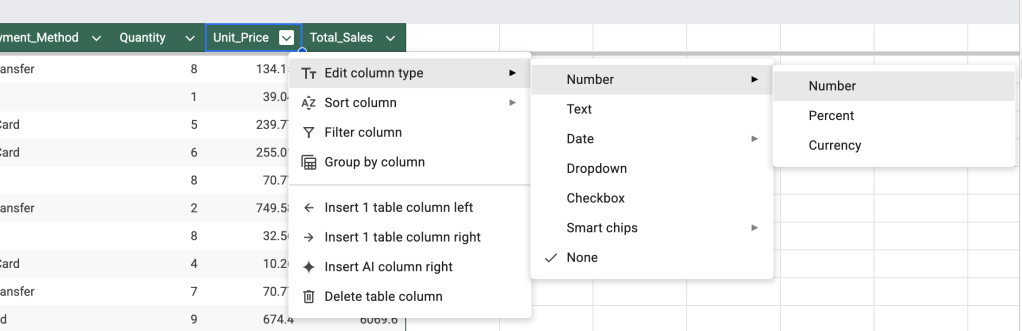
นอกจากนี้เรายังสามารถอ้างอิงถึงข้อมูลใน Table ได้ด้วยการใช้ TableName[ColumnName] แทนการใช้ ColumnRow แบบ A1, A2ได้ด้วย

Filter
เราสามารถกรองข้อมูลที่เราต้องการได้โดยไปที่หัว Column แล้วเลือก Filter Column
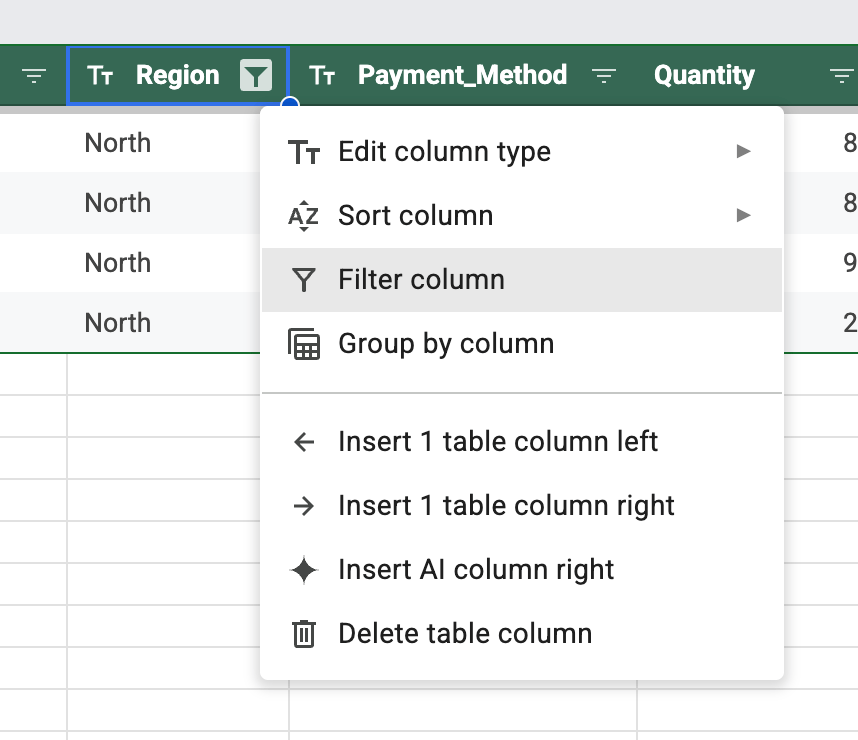
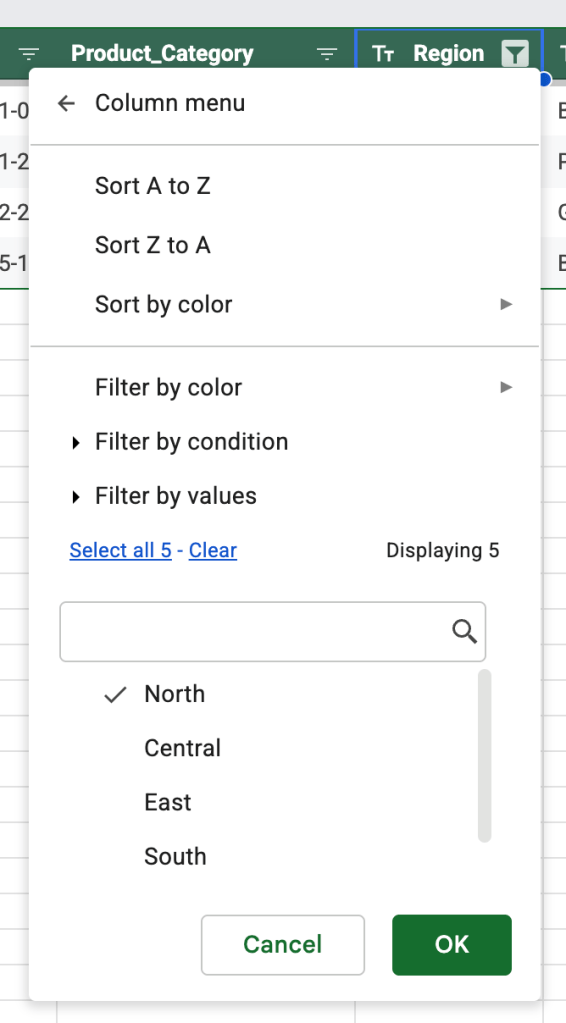
Filter View
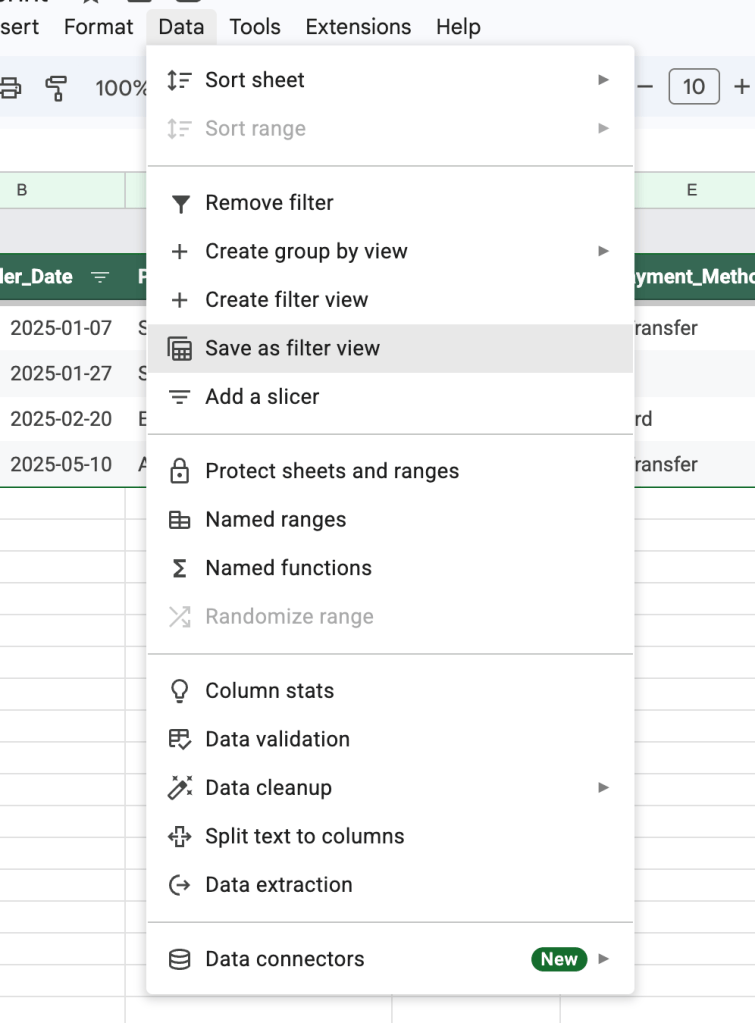
เมื่อเราทำการกรองข้อมูลแล้วเราสามารถ Save Filter ที่เราทำเก็บไว้ใช้ทีหลังได้ เช่นถ้าเราทำการ Filter หลาย Column แล้วต้องการใช้อีกในอนาคต เราทำได้โดยไปที่ Data → Save as filter view หรือจะเริ่มจาก Create filter view ก็ได้
Group by View
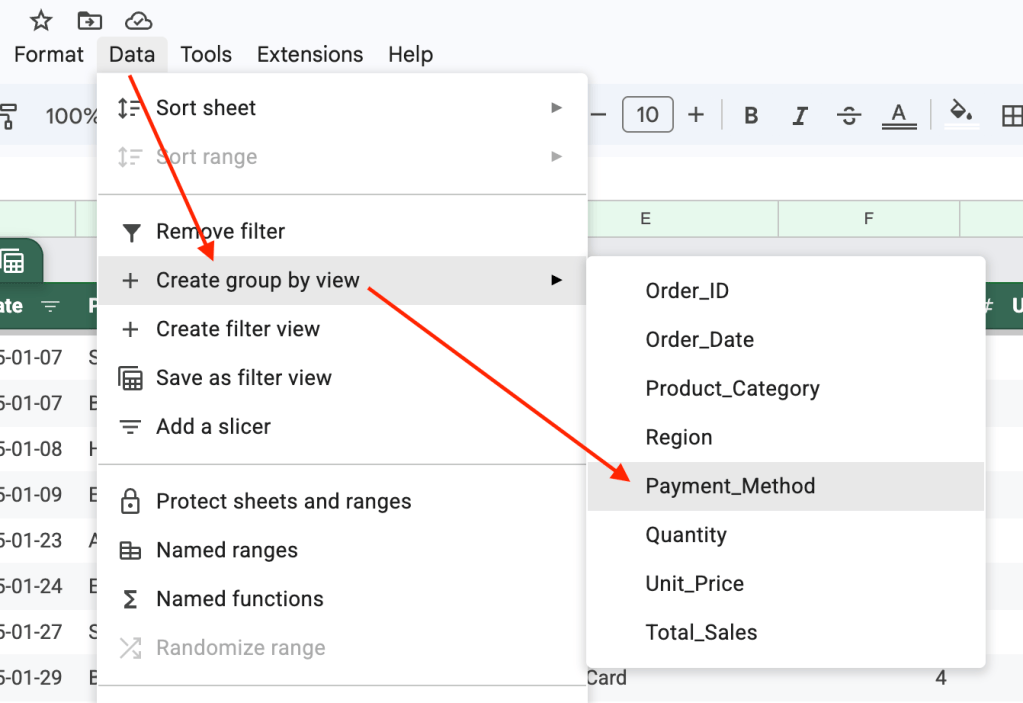
ถ้าเราต้องการ Group ข้อมูล เช่น อยากแยกข้อมูลด้วย Payment_Method เราสามารถทำได้โดยการไปที่ Data → Create group by view → เลือก Group ที่ต้องการ
ผลลัพธ์
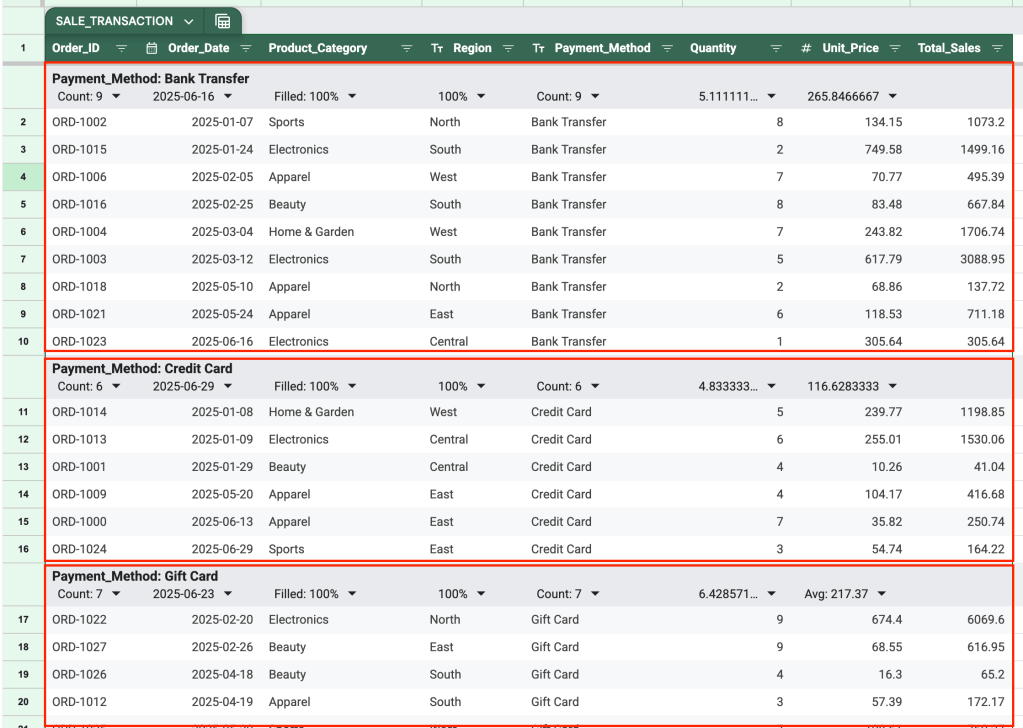
เราสามารถ Save Group by View ไว้ได้เหมือน Filter View เช่นกัน
Array Formula
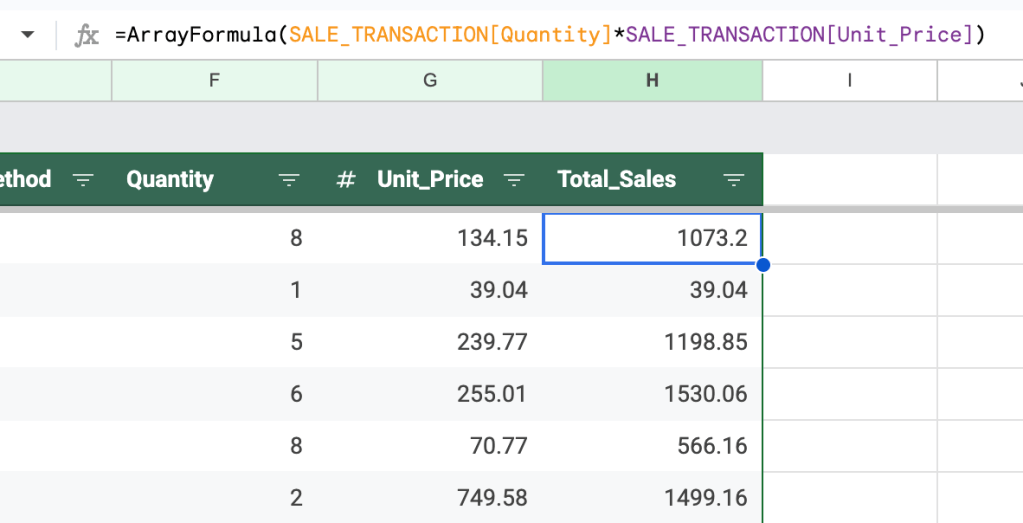
ใช้เพื่อ Apply Function ของเราไปที่ Area ที่เราต้องการแทนการ Copy & Paste ทุก Cell เช่น =ArrayFormula(SALE_TRANSACTION[Quantity]*SALE_TRANSACTION[Unit_Price])
Windows: Ctrl + Shift + Enter
Mac OS: Cmd + Shift + Enter
จากตัวอย่างด้านบน เริ่มจากพิมพ์ =SALE_TRANSACTION[Quantity]*SALE_TRANSACTION[Unit_Price] แล้วกด Cmd + Shift + Enter แล้ว Google Sheets จะเพิ่ม ArrayFormula() ให้โดยอัตโนมัติ
Filter and Sort
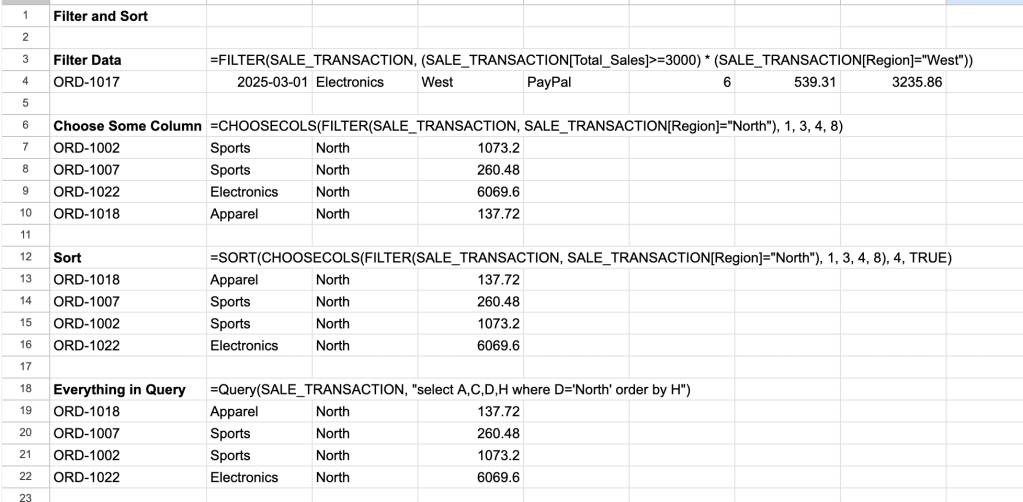
- Filter: Function สำหรับ Filter ข้อมูลตามเงื่อนไขที่เราต้องการ
- CHOOSECOLS: Function สำหรับเลือกเฉพาะ Column ที่เราต้องการมาแสดงผล
- SORT: เรียงข้อมูลน้อยไปมากหรือมากไปน้อยตามที่เราต้องการ
- ทั้งหมดสามารถเขียนเป็น Query ได้
- ถ้าต้องการชื่อ Column ด้วยให้ใช้ Query(TableName[#All])
Regular Expression
ใช้เพื่อทำงานกับ Pattern ของข้อมูล สามารถเรียนพื้นฐานได้ที่ https://datarockie.com/blog/intro-to-regular-expression-2/
ตัวอย่าง
- Filter ชื่อที่ขึ้นต้นด้วย B หรือ P: =FILTER(CRM_Data, REGEXMATCH(CRM_Data[First_Name], “^[BP]”)
- Filter ชื่อที่ไม่ได้ขึ้นต้นด้วย B หรือ P: =FILTER(CRM_Data, REGEXMATCH(CRM_Data[First_Name], “^[^BP]”)
- Filter ชื่อที่ลงท้ายด้วย A: =FILTER(CRM_Data, REGEXMATCH(CRM_Data[First_Name], “A$”)
Pivot Table
คือการบิด Table ของเรา เช่น เอาบาง Column ไปเป็น Row แทน โดย 1 Pivot Table ตอบ 1 คำถาม
เราจะแบ่งข้อมูลเป็น 2 อย่าง คือ
- Dimension: ข้อมูลที่คำนวณไม่ได้ เช่น ชื่อ นามสกุล Email
- Measure: ข้อมูลที่คำนวณได้ เช่น Amount
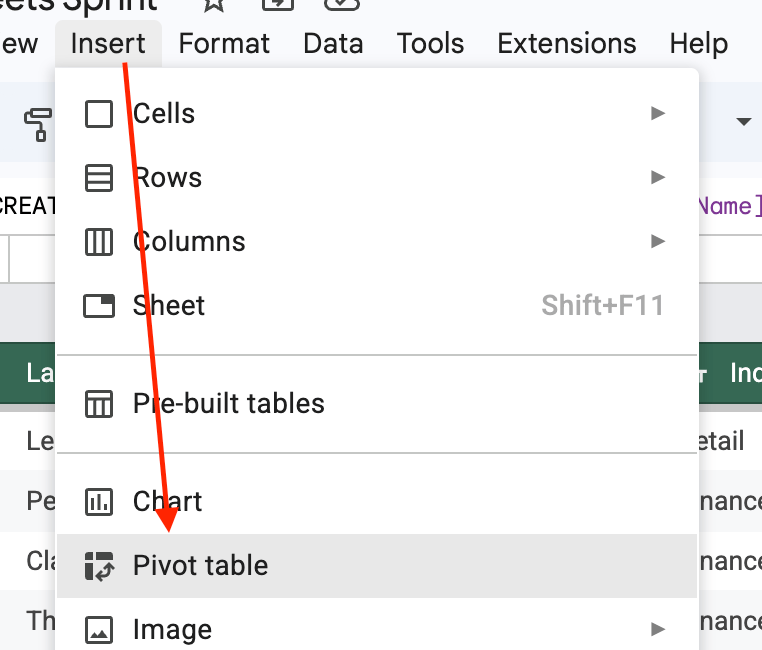
เราสร้าง Pivot Table ได้โดยไปที่ Insert → Pivot table
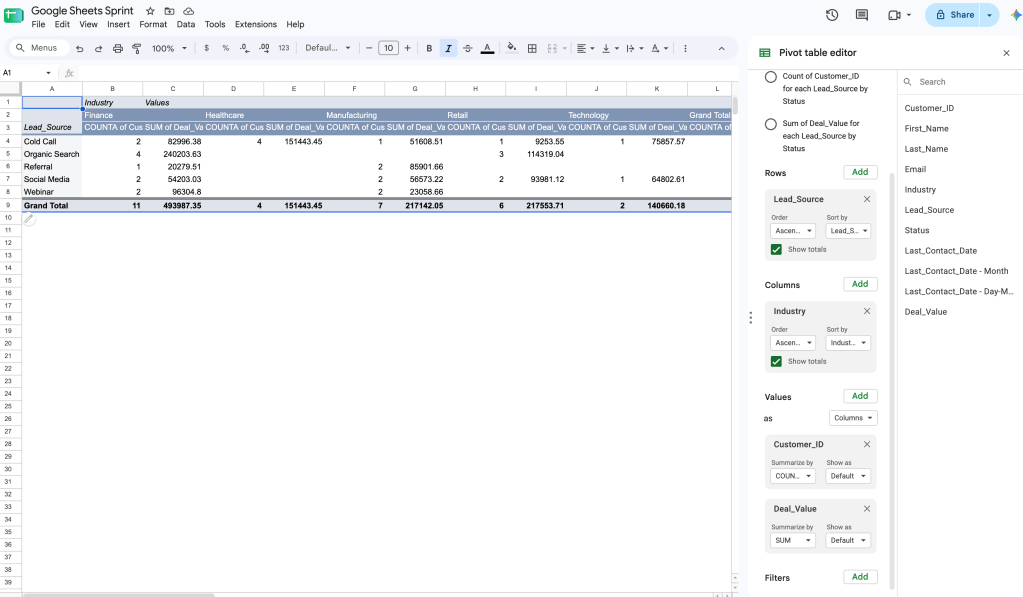
จากนั้นลาก Column ไปเป็น Row, Column, Value ที่เราต้องการ
Introduction to Pivot
UNIQUE(range)– List unique values inrangeSUMIF(range1, value, range2)– SUMrange2ifrangematches withvalueCOUNTIF()– Same asSUMIFbut count
All of the above can be done with Pivot feature.
- Row – Group of data we want to know i.e. Region
- Value – Value we want to aggregate i.e. Sum Total Revenue, Count Region (Transaction)
- Column – To pivot Dimension x Dimension i.e. Row=Region Column=Item
Nested Rows
- Add Multiple Rows will enable this feature
Calculated Field
- Add custom calculated fields